2.3 Driver Evaluation in
Vented Boxes
Now we will explore some frequency responses for a vented box.
 Select Clear Display from the Display menu. Select Clear Display from the Display menu.
 Select the 4th Order Vented Box from under the Box menu. Select the 4th Order Vented Box from under the Box menu.
To make a good vented box, you should start with a closed box that has a Q(tc) no higher than 0.7. In general, start with a low box frequency, say 40 Hz, and increase or decrease the box frequency in about 10 Hz steps until you see the range of responses possible for this box volume. Then, fine-tune the best of the responses for the flattest response.
We will start with a box Q(tc) of 0.65and try venting it at 35 Hz.
 Enter .65 in Q(tc) field in the Box Parameters window.
The required box volume is automatically calculated and displayed as
4.184 cubic feet. Enter .65 in Q(tc) field in the Box Parameters window.
The required box volume is automatically calculated and displayed as
4.184 cubic feet.
 Enter 35 (Hz) at the Box Freq. field in the Box Parameters window. Enter 35 (Hz) at the Box Freq. field in the Box Parameters window.
 Note that the Min. Vent Area,
S(v)min has been calculated and displayed in that field. Note that the Min. Vent Area,
S(v)min has been calculated and displayed in that field.
S(v)min = 6.5 sq. inches. This is the smallest vent area that would be free from vent noise.
 Select Calculate Response under the Analysis menu. (or use Ctrl+F from the keyboard)
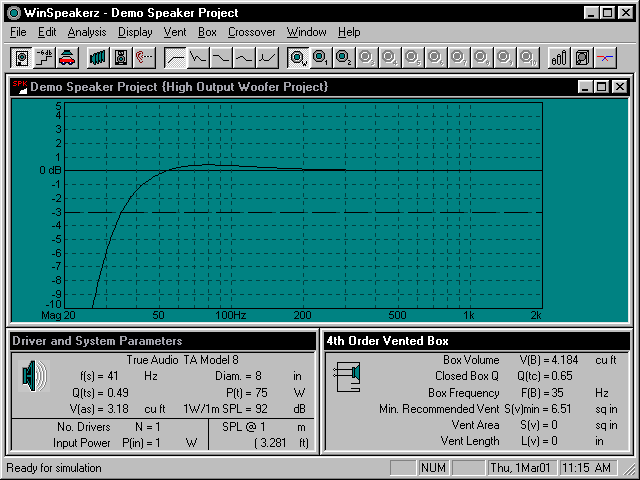
The frequency response is calculated and plotted as shown in Fig. 8
below. Select Calculate Response under the Analysis menu. (or use Ctrl+F from the keyboard)
The frequency response is calculated and plotted as shown in Fig. 8
below.

Figure 8: Vented Box with Q(tc) = .65, V(B) = 4.184 cu ft and F(B) = 35 Hz
You can see that venting the box has extended the low frequency cutoff from 65 Hz for the closed box to
about 34 Hz for the vented box tuned to 35 Hz. This response is slightly peaked in the 80 Hz region.
 Save this response in System 3. (or use Alt+3 from the keyboard) Save this response in System 3. (or use Alt+3 from the keyboard)
We could continue to look at higher box frequencies but they would only result in more peaked responses and higher cutoff frequencies. Tuning
the box lower will reduce the peak.
Now that we have completed the design for a vented enclosure we can open the Vent
Calculator and design a vent.
 Click on the Vent Calculator icon
at the toolbar. Click on the Vent Calculator icon
at the toolbar. 
We want to choose a vent(s) that will provide the recommended minimum vent area,
S(v)min (6.5 sq. in) or fairly close to that. Open the Vent Calculator and you'll notice that WinSpeakerz has recommended using 2 two-inch diameter tubes. The vent surface area is 6.283 sq. inches and each vent would be cut to 1.251 inches in length.

Figure 9: Recommended number of tubes
 Click on OK to
accept the recommendation and return to the Workbench. The vent
parameters are saved and transferred to the Box Window fields as shown
in Fig. 10 below.. Click on OK to
accept the recommendation and return to the Workbench. The vent
parameters are saved and transferred to the Box Window fields as shown
in Fig. 10 below..

Figure 10: Vent information displayed
 Save the contents of the Box Parameters window to System 3
again to store the new vent information. Save the contents of the Box Parameters window to System 3
again to store the new vent information.
2.4 The Excursion, Phase, Group Delay and Impedance
Response
Functions
Excursion Response 
 Switch the Excursion Response on by clicking on the excursion button
at the toolbar response group. (the second button from the left in the
button group below)

The excursion scale is calibrated in millimeters at the right side of the screen. The default scale goes from 0 to 15 millimeters. You can choose the appropriate scale for
a particular driver at the Analysis menu. At the Plot Window we can
now see that the Xmax, or linear excursion limit of the TA Model 8 driver is about
6 millimeters as indicated by the broken red horizontal line.
The solid red line indicates the peak excursion limit is 9 mm for this
driver.
 Recall the closed box with Q(tc) = .707 to the workbench from
memory 2. Calculate the response as we did above to see the
excursion response. (Ctrl+F from the keyboard) Recall the closed box with Q(tc) = .707 to the workbench from
memory 2. Calculate the response as we did above to see the
excursion response. (Ctrl+F from the keyboard)
The excursion response represents the
peak displacement of the speaker cone as a function of frequency. With only 1 Watt of input
the excursion response is very low. The
excursion will increase with input power just as the cone movement of a speaker increases as you turn up the volume. You can view the
excursion response of a system at any power level you wish by changing the
input power, P(in), in the Driver and System Parameters window.
 Enter
75 Watts for the input power and recalculate the response. (Ctrl+F)
Now, decrease the power to 50 Watts and calculate the response.
Repeat this again for 25 Watts. Enter
75 Watts for the input power and recalculate the response. (Ctrl+F)
Now, decrease the power to 50 Watts and calculate the response.
Repeat this again for 25 Watts.
We can see that the excursion response of this driver at its full rated
power of 75 Watts goes over both the mechanical and linear excursion
limits. At 50 Watts the excursion stays just under the mechanical
limit but is over the linear limit at the lowest frequencies. At
25 Watts the system just hits the linear limit (Xmax) at the lowest
frequencies. We
should probably derate the power handling of this closed box system to
something less than the 75 Watt rating of the driver. It is not
unusual that a speaker system cannot handle the full rated power of
the driver due to excursion response limitations.

Figure 11: Excursion Response at 1, 25, 50 and 75 Watts of Input Power
WinSpeakerz shows you the excursion response of
a system against both the linear and mechanical excursion limits of the driver. Linear excursion is the X(max) that manufacturers normally quote on their drivers. X(max) is the furthest the cone can travel (in one direction) before significant distortion occurs. The mechanical excursion limit, X(peak), is the maximum distance the cone can travel before hitting a mechanical stop, such as the backplate. When the voicecoil reaches the mechanical limit it causes a loud, unpleasant popping noise. There is some risk a driver will be damaged when it
slams into the backplate and "bottoms out". The mechanical limit represents an absolute limit to
operation of a speaker. WinSpeakerz excursion response lets you predict how loud your systems will be able to play before the onset of significant distortion. You can
also see how loud your speaker will play at any distance and power.
Phase Response
 Toggle off the Excursion Response from the toolbar. Toggle off the Excursion Response from the toolbar.

 Toggle on the Phase Response. Toggle on the Phase Response.

 Calculate
the phase response for the closed box. (Ctrl+F) Calculate
the phase response for the closed box. (Ctrl+F)
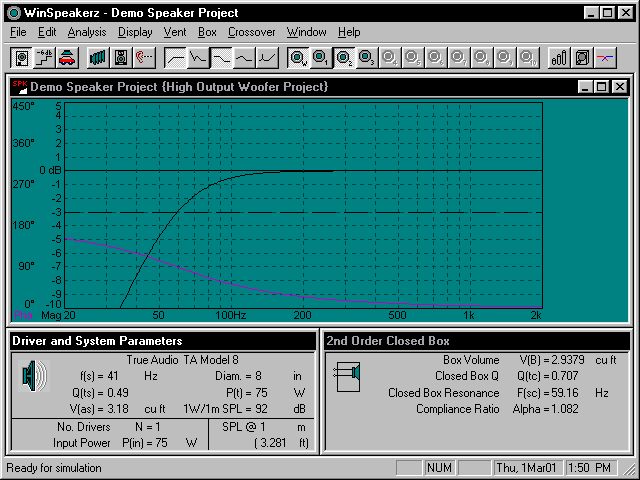
The Phase scale is on the left side of the screen. The default Phase scale is calibrated from 0 degrees to 450 degrees in 30-degree increments. Each grid step is 30 degrees.
At high frequencies the input and output of a driver subsystem are in phase. At lower frequencies the output shifts to
increasing phase angles consistent with a high-pass filter. In Fig. 12
below we see this behavior. For a closed box the phase response
goes through 90 degrees at the system resonance frequency F(sc) and
ultimately approaches 180 degrees. Vented boxes approach a full
360 degree phase shift at the lowest frequencies.

Figure 12: A Typical Closed Box Phase Response
Ideally, in a perfect loudspeaker, the output would always be an exact reproduction of the
input with the phase angle unchanged. However, in general, the output phase of a speaker system is different from the input.
Phase response, per se, is generally considered to be inaudible to the humans ear but
phase response becomes very important when you combine signals, such as
combining the outputs of a woofer and a tweeter. We need to know how
the drivers combine in the crossover region because accurate summing at the listening location depends on the
phase response of each driver as well as on the distance from the
listener to each driver. If they happen to be 180 degrees out of phase they will
cancel and you will get a notch in the frequency response at that frequency.
Regardless of the audibility of the phase response, a notch in the
frequency response will be clearly audible.
Group Delay Response
 Toggle off the Phase Response. Toggle off the Phase Response.
 Toggle on the Delay Response. Toggle on the Delay Response.

 Calculate
the delay response for the closed box. (Ctrl+F) Calculate
the delay response for the closed box. (Ctrl+F)
The Delay scale is calibrated in milliseconds and is displayed on the right side of the plot window. The calibration scale can be adjusted under the Analysis menu. The default setting at startup is
15 msec.
The group delay response represents the system delay time. It's the delay of the signal
"envelope" from the system electrical input to the speaker's acoustic output. Group
delay is important because we don't want any perceptible differences in time delay among the various frequency components of
the program material. If the time misalignment or 'time smear' is bad enough it will be audible.
As we can see in Fig. 13 below, at high frequencies there is virtually no delay. As you go down in frequency the delay increases near the cutoff region. Audibility thresholds for group delay remain
poorly known in the bass range. One widely cited paper by Blauert and Laws reports thresholds of audibility at 500 Hz to be 3.2 msec. At lower frequencies the threshold is likely to be proportionately higher.

Figure 13: A Typical Group Delay Response
Impedance Response
 Toggle off the Delay Response. Toggle off the Delay Response.
 Toggle on the Impedance Response. Toggle on the Impedance Response.

 Calculate
the impedance response for the closed box. (Ctrl+F) Calculate
the impedance response for the closed box. (Ctrl+F)
The Impedance scale is displayed at the right side of screen in ohms. The shape of a loudspeaker's impedance curve reveals much about a speaker. For example a closed box speaker system will have an
impedance response with a single resonance peak. A Vented box will have two
peaks in the impedance response.
The impedance response represents 'resistance' if you will, as a function of frequency. An ideal
impedance response would be a nice flat line at the nominal impedance of the speaker. In fact, most real world loudspeakers do not have a flat
impedance response. Typically a woofer system will have an impedance peak at the systems' low frequency resonance or two peaks in the case of a vented box. At higher frequencies the speakers impedance will increase due to the effect of voice coil inductance.
See Fig. 14 below.

Figure 14: A Typical Closed Box Impedance Response
|